Which indicators provide the best signals for profitable day trading? – Which indicators provide the best signals for profitable day trading? Ah, the million-dollar question (or perhaps the million-dollar
-trade* question!). Day trading, that thrilling rollercoaster of financial highs and lows, demands precision. It’s not just about throwing darts at a board hoping to hit a bullseye; it’s about harnessing the power of market data, interpreting those cryptic charts, and using indicators like a seasoned detective solves a case.
This journey into the world of profitable day trading indicators will equip you with the knowledge to decipher the market’s whispers and potentially transform your trading game. Prepare for a whirlwind tour of technical analysis, where we’ll uncover the secrets behind RSI, moving averages, Bollinger Bands, and much more – all with a healthy dose of humor (because let’s face it, trading can be stressful!).
We’ll explore a range of technical indicators, from the classic moving averages that chart the course of price trends to the more nuanced RSI and Bollinger Bands, which offer insights into overbought and oversold conditions and potential price reversals. We’ll delve into the world of volume-based indicators, uncovering how volume confirms price movements and reveals hidden breakouts. Mastering price action analysis, including candlestick patterns and support/resistance levels, will add another layer to your trading arsenal.
Finally, we’ll discuss market sentiment indicators, like the Put/Call ratio and the VIX, which provide a pulse of market fear and optimism. Get ready to become a data-driven trading ninja!
Technical Indicators for Day Trading

Day trading, the thrilling rollercoaster of buying and selling within a single day, demands sharp tools. Technical indicators are those tools, offering glimpses into market sentiment and potential price movements. While no indicator guarantees riches (or prevents ruin!), understanding their strengths and weaknesses is crucial for navigating the daily market frenzy. Let’s delve into some key players.
Relative Strength Index (RSI)
The RSI, a momentum oscillator, measures the magnitude of recent price changes to evaluate overbought or oversold conditions. It oscillates between 0 and 100. Readings above 70 generally suggest an overbought market, hinting at a potential price reversal (a drop). Conversely, readings below 30 often signal an oversold market, suggesting a potential bounce back. However, RSI isn’t a crystal ball; it’s prone to false signals, especially in strong trends.
For example, a stock in a powerful uptrend might stay above 70 for extended periods, defying the traditional “overbought” interpretation. Successful RSI usage involves combining it with other indicators and considering the overall market context.
Predicting profitable day trades? It’s trickier than guessing the final score, even with all those fancy moving averages. Sometimes, you need a bit of off-field insight, like checking out the latest football news for unexpected market shifts – a star player’s injury could ripple through related stocks! Ultimately, though, the best indicators for day trading are a combination of technical analysis and a healthy dose of gut feeling (and maybe a lucky rabbit’s foot).
Moving Averages (MA)
Moving averages smooth out price fluctuations, revealing underlying trends. They’re calculated by averaging prices over a specific period (e.g., 50 days, 200 days). Shorter-term MAs (like the 50-day MA) are more responsive to recent price changes, while longer-term MAs (like the 200-day MA) provide a smoother, longer-term trend indication. A “golden cross” – when a shorter-term MA crosses above a longer-term MA – is often interpreted as a bullish signal, suggesting a potential uptrend.
Conversely, a “death cross” – when a shorter-term MA crosses below a longer-term MA – is seen as a bearish signal, hinting at a potential downtrend. However, crossing signals aren’t foolproof; they can be late to the party, and false signals can occur. Consider, for instance, a brief dip in a strong uptrend generating a false death cross.
Wrestling with which indicators scream “profit!” in day trading? Honestly, it’s a jungle out there! But to even see those signals clearly, you need a decent platform, right? That’s where a top-notch app comes in, like the ones you might find if you check out this link for Highly-rated mobile app for day trading in the Canadian market?
Then, armed with a killer app and a keen eye, you can conquer those market indicators and maybe, just maybe, become a day-trading legend (or at least, pay the rent).
Bollinger Bands
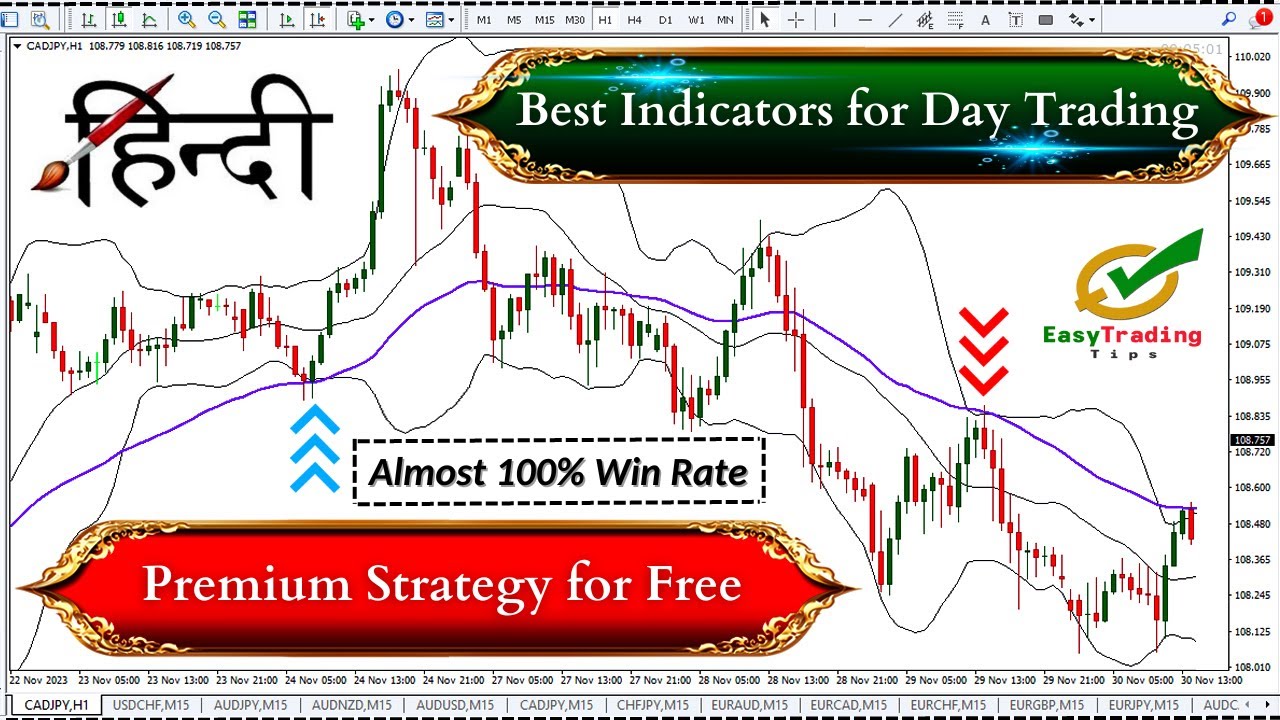
Bollinger Bands consist of three lines: a simple moving average (usually 20-period) and two standard deviation bands above and below it. They illustrate price volatility. When prices touch the upper band, it might signal an overbought condition and a potential price reversal (downward). Conversely, when prices touch the lower band, it might suggest an oversold condition and a potential price reversal (upward).
The widening of the bands indicates increased volatility, while narrowing suggests decreased volatility. Remember, like other indicators, Bollinger Bands don’t predict the future; they highlight potential turning points within the context of price action and volatility. For example, a breakout above the upper band in a strong uptrend might signal continued upward momentum rather than a reversal.
Indicator Comparison
| Indicator | Strengths | Weaknesses | Typical Day Trading Applications |
|---|---|---|---|
| RSI | Identifies overbought/oversold conditions, momentum shifts | Prone to false signals, especially in strong trends | Identifying potential price reversals, confirming trend changes |
| Moving Averages (50-day, 200-day) | Identify trend direction, generate buy/sell signals (golden/death crosses) | Can lag behind price movements, susceptible to whipsaws | Identifying trend direction, confirming breakouts/breakdowns |
| Bollinger Bands | Illustrates volatility, identifies potential price reversals, confirms breakouts/breakdowns | Can generate false signals in sideways markets, requires confirmation from other indicators | Identifying potential price reversals, assessing volatility, confirming trend changes |
Volume-Based Indicators for Day Trading
Volume, the often-overlooked sidekick of price, is actually a crucial character in the day trading drama. It’s the silent observer, whispering secrets about market sentiment and the strength of price movements. Ignoring volume is like trying to solve a mystery with only half the clues – you might get lucky, but you’re setting yourself up for a world of hurt.
Understanding how volume interacts with price is key to unlocking more profitable trading strategies.
On-Balance Volume (OBV) and Price-Volume Divergences
The On-Balance Volume (OBV) indicator is a cumulative total of volume, adjusted to reflect positive or negative price changes. A rising OBV suggests accumulating buying pressure, even if the price itself isn’t dramatically increasing. Conversely, a falling OBV signals increasing selling pressure, even if the price shows minor upward movements. The real magic happens when you spot divergences.
Predicting the market’s whims is like wrestling a greased piglet – you think you’ve got it, then bam! But seriously, nailing profitable day trades hinges on choosing the right indicators. Before you even think about diving in, though, you need a solid platform; check out Best Canadian day trading platform for beginners in 2024? to get started.
Then, armed with the right tools and a platform that won’t spontaneously combust, you can start mastering those crucial indicators for day trading success.
For example, if the price makes a series of higher highs, but the OBV makes lower highs, it’s a bearish divergence – a warning sign that the upward momentum might be weakening. Think of it as a hidden warning from the market, saying, “Hey, this rally might be a bit…
gaspy*… unsustainable.” The opposite is true for bullish divergences; rising OBV with falling price highs can signal a potential reversal to the upside.
Predicting the market’s mood is like reading tea leaves, but some indicators, like RSI and MACD, offer slightly less hazy glimpses. Of course, picking the right indicators is only half the battle; you also need a solid platform to execute your trades swiftly and efficiently. That’s where the question, What’s the best all-around day-trading platform available in Canada?
, becomes crucial. Ultimately, even the best indicators are useless without a reliable platform to act on them – so choose wisely!
Interpreting Volume Spikes
Volume spikes are like exclamation points in the market’s sentence. A sudden surge in volume accompanying a price breakout signals strong conviction in the move. It’s like a stampede of bulls or bears, depending on the direction of the price movement. This increased participation confirms the breakout’s legitimacy, suggesting a higher probability of the trend continuing. However, a volume spike with little or no price movement might indicate indecision or a potential reversal.
Imagine a scene where a crowd is buzzing with excitement, but the actual action is minimal – it’s a sign that something is brewing, but it’s not quite ready to boil over.
So, you’re hunting for the holy grail of day trading indicators? Forget crystal balls; reliable signals come from mastering volume, price action, and maybe a sprinkle of RSI magic. But first, you need a killer platform! Check out this awesome comparison of Canadian day trading platforms: Comparison of the best day trading platforms available in Canada? Once you’ve got your tech sorted, you can really focus on honing your indicator skills and turning those signals into sweet, sweet profits.
Volume’s Crucial Insights for Day Traders
Let’s look at some scenarios where volume provides crucial insights:
- Confirmation of Breakouts: High volume accompanying a price breakout increases the likelihood of a sustained move in that direction.
- Identification of Weakness: Low volume during a price rally suggests weak momentum and a potential reversal.
- Detection of Distribution: High volume during a price decline indicates significant selling pressure.
- Spotting Hidden Strength: High volume during a price consolidation phase suggests accumulation and potential future upside.
- Identifying Exhaustion: High volume at the end of a strong price move can signal exhaustion and a potential reversal.
Price Action Analysis for Day Trading

Price action analysis, the art of deciphering market sentiment directly from price movements and candlestick patterns, is a cornerstone of successful day trading. Unlike relying solely on indicators that can lag behind price changes, price action focuses on the present, offering potentially quicker insights into market momentum and reversals. It’s like being a detective, piecing together clues from the price chart to anticipate the market’s next move.Price action analysis empowers traders to identify potential entry and exit points with increased precision, reducing reliance on potentially misleading signals from lagging indicators.
Predicting market movements is like trying to catch greased squirrels – tricky! While indicators like RSI and MACD can offer clues, remember that even the best signals are useless if your broker eats your profits in fees. That’s why figuring out Which broker offers the lowest fees for day trading in Canada? is crucial. After all, what’s the point of a perfect prediction if you’re left with pennies after commissions?
So, nail down the low-fee broker, then refine your indicator strategy!
By focusing on the raw data – the price itself – traders gain a more intuitive understanding of market dynamics and can develop a sharper trading edge.
Key Price Action Patterns and Their Implications
Recognizing classic price action patterns is crucial for anticipating potential price reversals or continuations. These patterns often emerge at significant support and resistance levels, amplifying their predictive power. For example, a head and shoulders pattern, characterized by three peaks (the left shoulder, head, and right shoulder), suggests a potential bearish reversal after the right shoulder is formed. Conversely, an inverse head and shoulders pattern signals a potential bullish reversal.
Double tops and double bottoms represent similar reversal patterns, but with only two peaks or troughs. These patterns, while not foolproof, offer high-probability trading setups when combined with other confirmation signals.
Using Candlestick Patterns to Predict Price Movements
Candlestick patterns, visually rich representations of price movement over a specific period, offer a unique window into market sentiment. A doji candlestick, characterized by a small real body and long upper and lower shadows, indicates indecision in the market, often suggesting a potential reversal. A hammer candlestick, featuring a small real body at the bottom of a long lower shadow, signals a potential bullish reversal, as buyers stepped in to prevent further price decline.
Engulfing patterns, where a large candlestick completely engulfs the previous one, are strong reversal signals, suggesting a shift in market momentum. For example, a bullish engulfing pattern (where a large green candlestick engulfs a previous red one) implies that buyers have overpowered sellers.
The Importance of Support and Resistance Levels in Day Trading
Support and resistance levels represent price zones where buyers (support) or sellers (resistance) are likely to exert significant influence. These levels often correspond to previous price highs or lows, psychological price points (like round numbers), or significant chart patterns. A break above resistance often signals a bullish breakout, while a break below support can trigger a bearish breakdown.
Day traders use these levels to identify potential entry and exit points, setting stop-loss orders below support or above resistance to limit potential losses.
Visual Representation of a Candlestick Chart
Imagine a candlestick chart showing a series of candles. A clear example of a head and shoulders pattern is visible, with three distinct peaks forming the left shoulder, head, and right shoulder. The neckline, connecting the lows of the left and right shoulders, acts as a crucial support level. A subsequent break below this neckline confirms the pattern and signals a potential bearish move.
Meanwhile, a hammer candlestick appears at the bottom of the subsequent price decline, suggesting a possible temporary low and potential bullish reversal. The chart also shows clear support and resistance levels, where previous price highs and lows have acted as significant turning points. The resistance level is clearly breached after a strong bullish engulfing pattern, leading to a significant price increase.
The visual narrative of these elements together provides a clear example of how various price action elements combine to form a coherent trading strategy.
Combining Indicators for Enhanced Signals: Which Indicators Provide The Best Signals For Profitable Day Trading?

Day trading, my friend, is a wild rollercoaster. One indicator might whisper sweet nothings of impending riches, while another screams bloody murder about an imminent crash. The secret sauce? Don’t rely on a single indicator; it’s like trying to navigate a maze with only one hand. Combining indicators adds layers of confirmation, increasing the probability of making profitable trades (while simultaneously decreasing the chance of losing your shirt).
Think of it as assembling a superhero team, each member possessing unique strengths that complement each other.Combining different indicators provides a more robust and reliable signal than relying on any single indicator alone. This approach significantly reduces the noise and increases the signal-to-noise ratio, leading to more informed trading decisions. It’s like having a chorus of analysts instead of just a single, possibly biased, voice.
RSI and Moving Average Convergence
Let’s say you’re eyeing a stock, and the 14-period Relative Strength Index (RSI) is showing an oversold condition (below 30), suggesting a potential bounce. However, the 20-day simple moving average (SMA) is still trending downwards. This discrepancy raises a red flag. A confirmed buy signal would only emerge if the RSI indicates oversold conditionsand* the 20-day SMA shows a clear upward trend reversal, suggesting a bullish crossover.
This combination reduces the likelihood of a false signal triggered by a temporary dip. Imagine it as a double-lock system on your trading vault – one indicator is a padlock, the other is a combination lock. Only when both align can you safely access your profits.
Risk Management with Multiple Indicators
Using multiple indicators doesn’t magically eliminate risk; it just helps you manage it more effectively. The more indicators you use, the more complex your trading strategy becomes. This necessitates stricter risk management practices. A diversified portfolio, appropriate position sizing, and stop-loss orders are crucial. Never bet the farm on a single trade, regardless of how many indicators are singing its praises.
Remember, even the best-laid plans can go awry in the unpredictable world of day trading. Think of it like this: Even a superhero team can face defeat if they aren’t well-coordinated and strategically prepared.
Confirmation Signals and Reducing False Signals, Which indicators provide the best signals for profitable day trading?
Confirmation signals are the holy grail of day trading. They represent a convergence of multiple indicators pointing towards the same trading direction. For instance, a bullish confirmation might involve a rising price, increasing volume, a bullish crossover of moving averages, and an RSI above 50. The more indicators align, the stronger the signal, and the lower the risk of a false signal.
Think of it like a jury deciding a verdict – the more jurors agree, the stronger the conviction (and in this case, your confidence in the trade).
Flowchart for Combining Indicators and Interpreting Signals
A simple flowchart can guide the process. Imagine a flowchart with three branches. The first branch represents the price action (e.g., price breaking above resistance). The second branch represents a momentum indicator (e.g., RSI above 70). The third branch represents a trend indicator (e.g., 50-day moving average).
If all three branches point to a buy signal (price breaks resistance, RSI above 70, and 50-day MA is upward sloping), then proceed to execute the trade. If not all three branches align, the signal is weak and should be avoided. This flowchart ensures a structured approach to signal interpretation, reducing emotional trading decisions. It’s like having a step-by-step instruction manual for your trading superhero team.
Closing Notes

So, which indicators provide the best signals for profitable day trading? The truth is, there’s no magic bullet. The holy grail of day trading isn’t a single indicator, but a masterful combination of technical analysis, price action understanding, volume interpretation, and a healthy dose of risk management. By combining different indicators, you can create a more robust and reliable system, reducing false signals and increasing your chances of profitable trades.
Remember, consistent learning and adapting your strategies are key to long-term success in this exciting, yet challenging, world. Now go forth and conquer the markets (responsibly, of course!).
